
Welcome to the complete HookedIn tutorial! Whether you're new to the platform or looking to master advanced features, this step-by-step guide will help you unlock the full potential of HookedIn's real-time incident intelligence system.
🚀 What You'll Learn
- Setting up and navigating Live Alerts
- Using advanced filtering and search
- Mastering the Analytics Dashboard
- Optimizing your workflow across desktop and mobile
- Best practices for maximum efficiency
Getting Started: Your Dashboard Overview
When you first log into HookedIn, you'll land on your personalized dashboard. The clean, intuitive interface is designed to get you to incidents faster, whether you're using our desktop platform or mobile app.
The main navigation includes:
- Home: Your personalized dashboard
- Alerts: Real-time incident monitoring
- Analytics: Data insights and heatmaps
- Feedback: Report issues or suggestions
- Blog: Industry insights and tutorials
- Help: Support and documentation
Section 1: Mastering Live Alerts (Desktop)
The Live Alerts section is the heart of HookedIn's platform. Here's how to make the most of it on desktop:
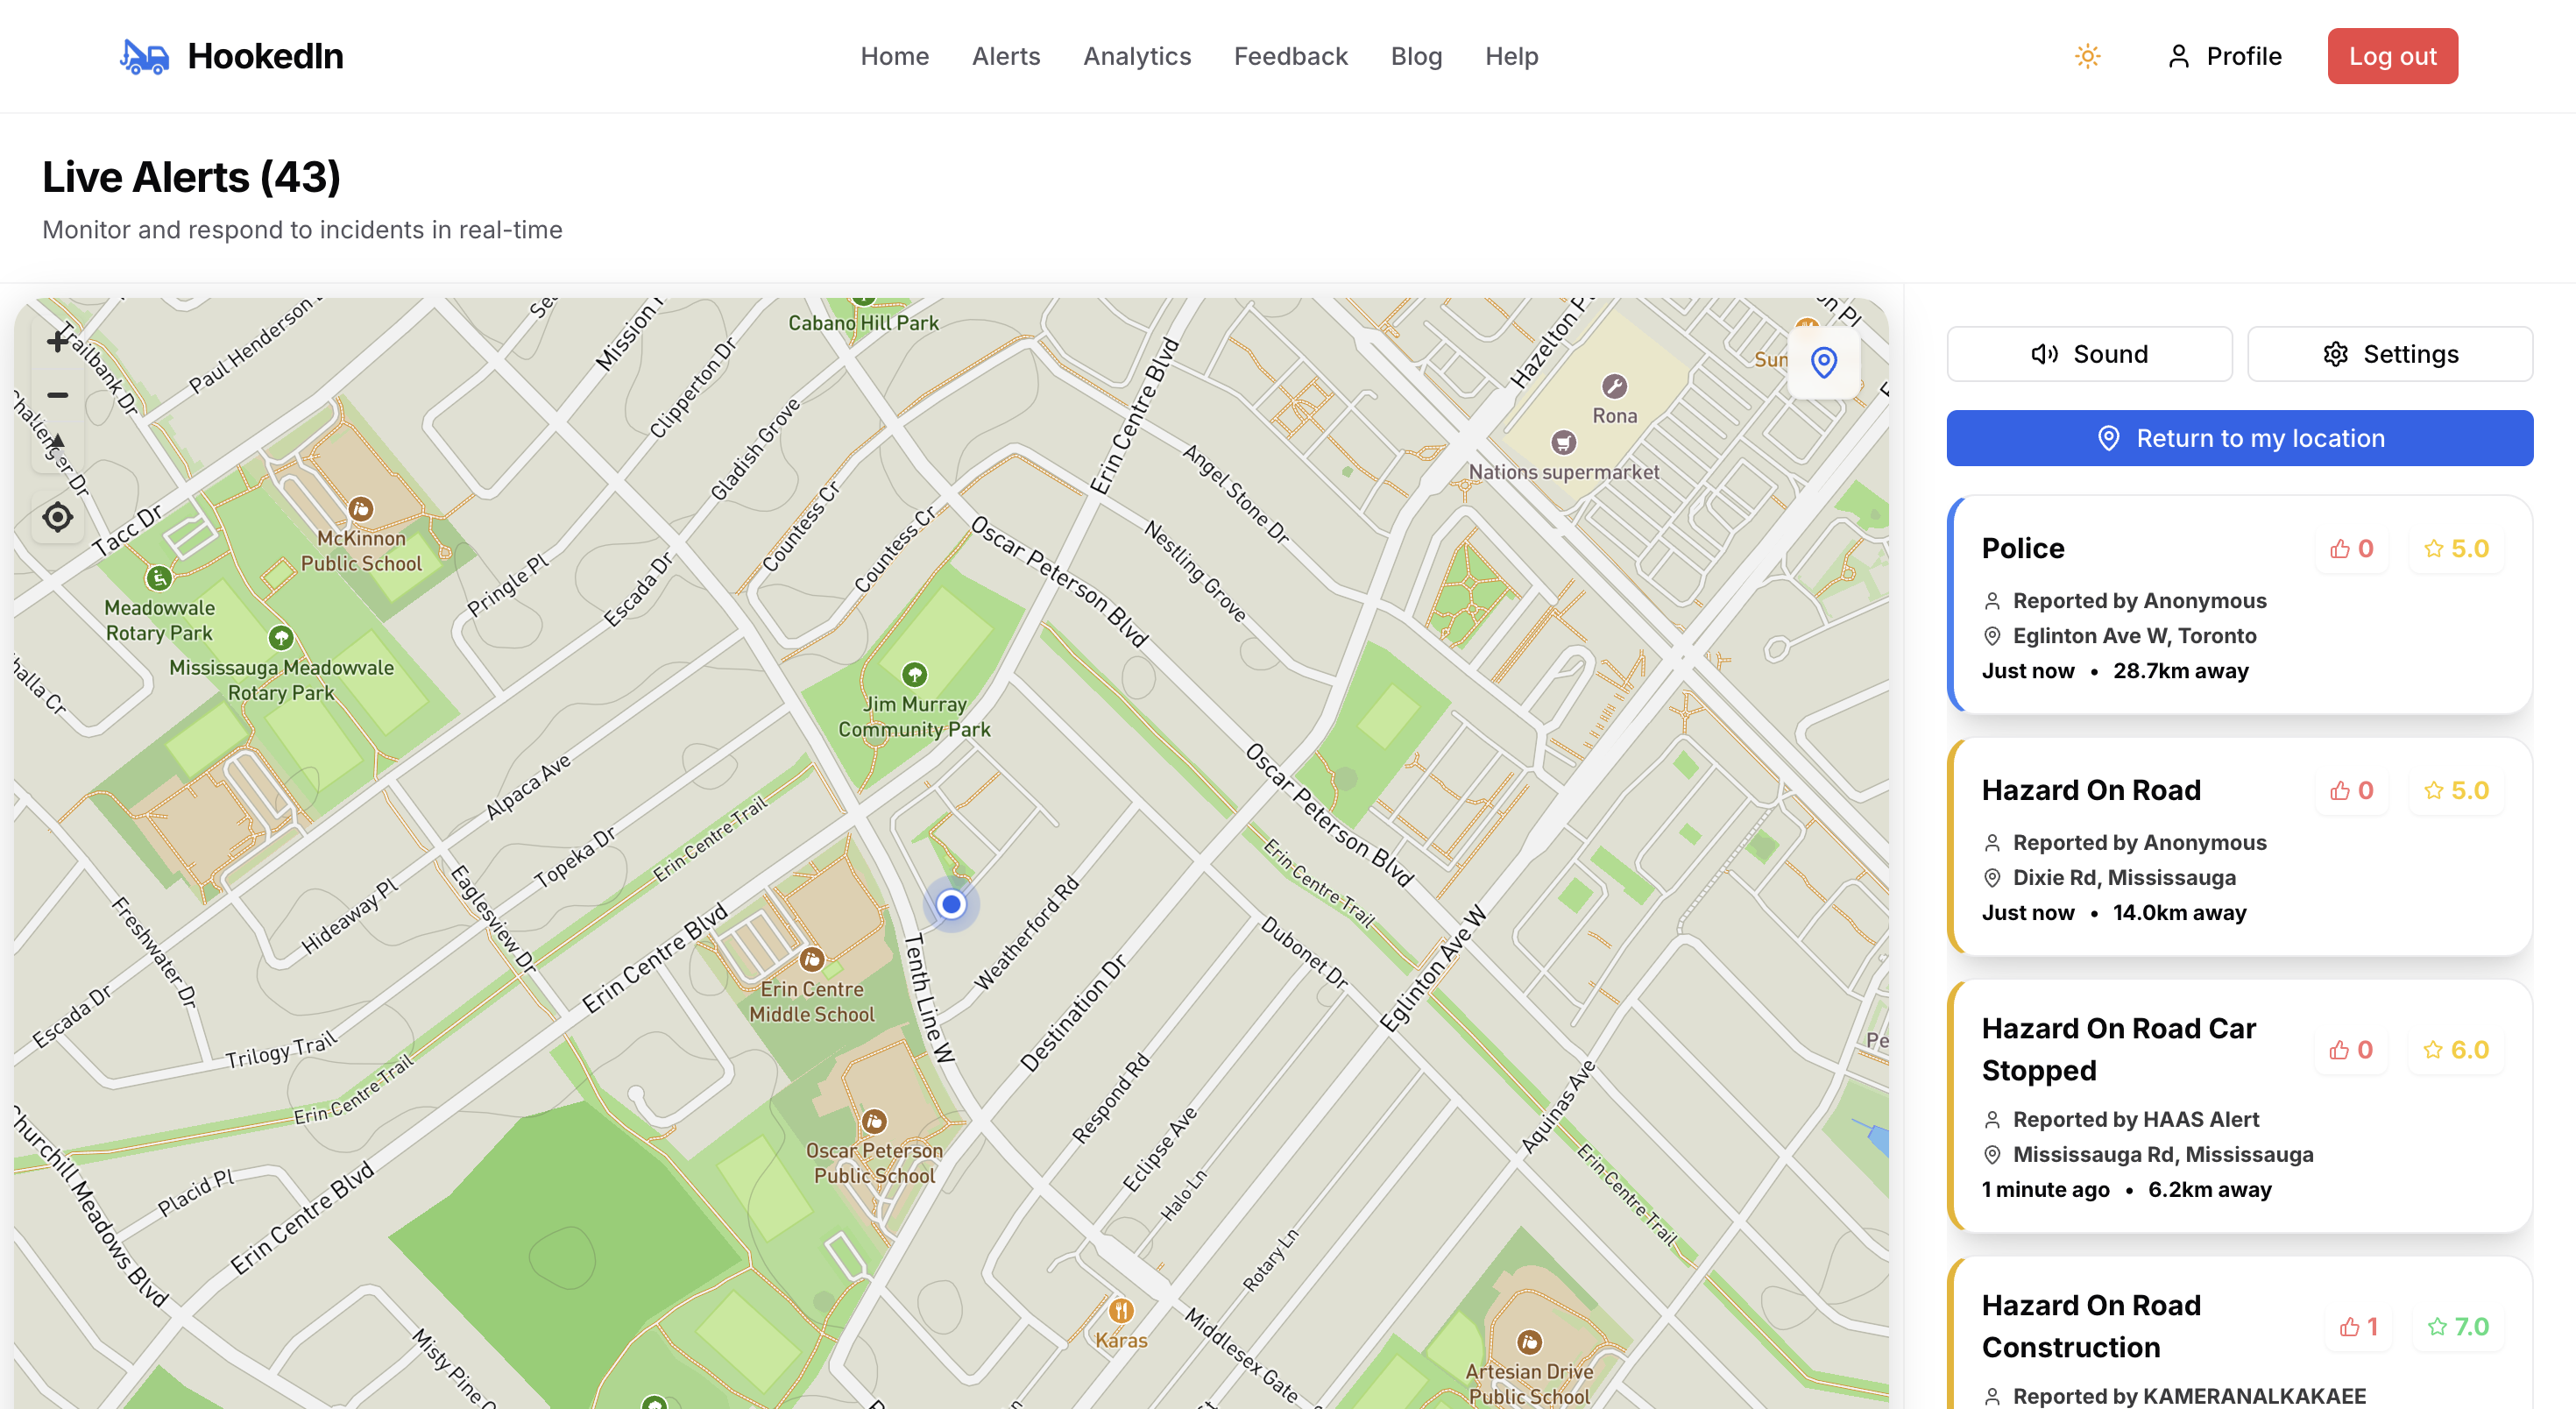
Desktop Live Alerts showing real-time incident monitoring with map and alert list
Understanding the Interface
The desktop Live Alerts view provides a comprehensive overview with several key components:
- Interactive Map: Shows your location and nearby incidents with color-coded markers
- Alert Counter: Displays the total number of active alerts (43 in the example)
- Alert List: Detailed information about each incident on the right side
- Control Panel: Sound settings, location services, and preferences
Reading Alert Information
Each alert in the list contains crucial information:
- Alert Type: Police, Hazard on Road, Construction, etc.
- Reporter: Who reported the incident (Anonymous, HAAS Alert, etc.)
- Location: Specific address or road name
- Time: How recently the incident was reported
- Distance: How far the incident is from your current location
- Ratings: Community feedback on alert accuracy
Essential Controls
- Sound Toggle: Enable/disable audio notifications
- Settings: Customize your alert preferences
- Return to Location: Quickly center the map on your position
Section 2: Advanced Analytics Dashboard
The Analytics section transforms raw incident data into actionable insights for strategic positioning and business optimization:
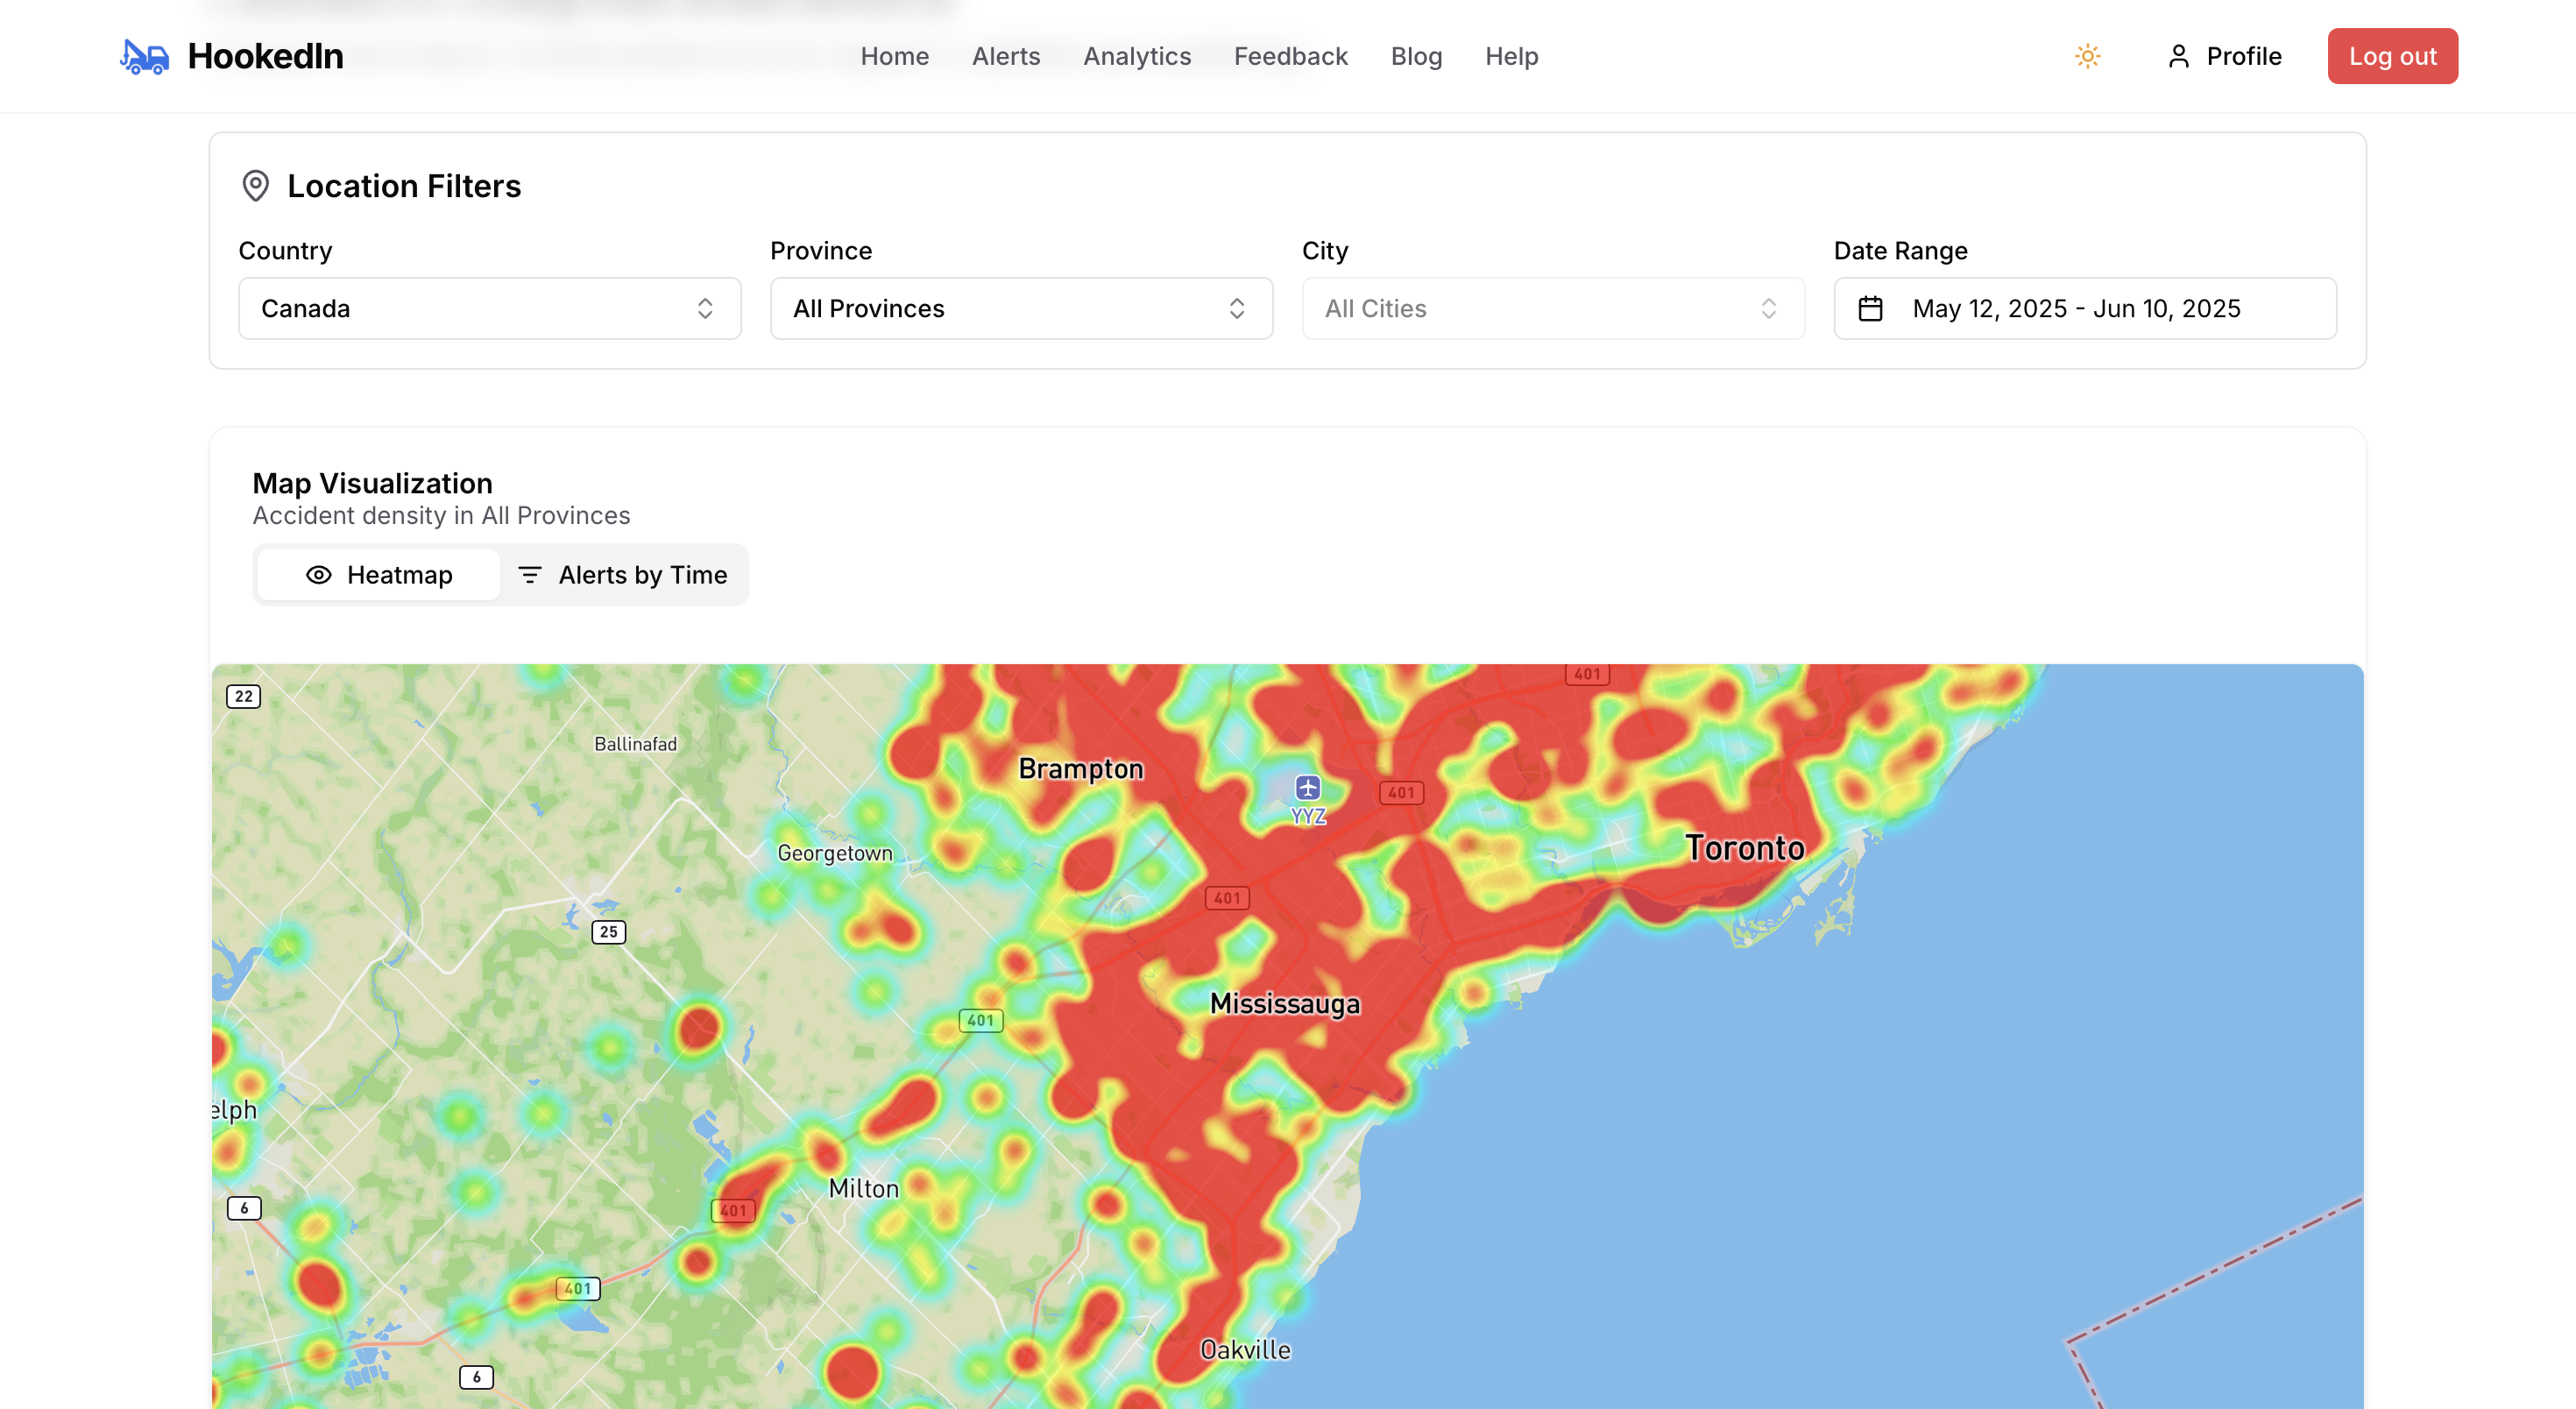
Analytics dashboard featuring location filters and incident density heatmap
Location Filters
The powerful filtering system helps you analyze specific areas and time periods:
- Country Filter: Focus on specific countries (Canada shown)
- Province Filter: Narrow down to provinces or states
- City Filter: Target specific metropolitan areas
- Date Range: Analyze historical patterns over time
Visualization Options
Choose between different data visualization methods:
- Heatmap View: Shows incident density with color-coded zones
- Alerts by Time: Temporal analysis of incident patterns
Reading the Heatmap
The heatmap uses color intensity to show incident density:
- Red Areas: High incident density - prime positioning zones
- Orange/Yellow: Moderate incident activity
- Green/Blue: Lower incident frequency
- Water/Empty Areas: No incident data
"Use the heatmap to identify your most profitable positioning areas. The red zones typically offer the highest job volume."
Section 3: Mobile Live Alerts (List View)
The mobile experience is optimized for on-the-go access and quick decision-making:
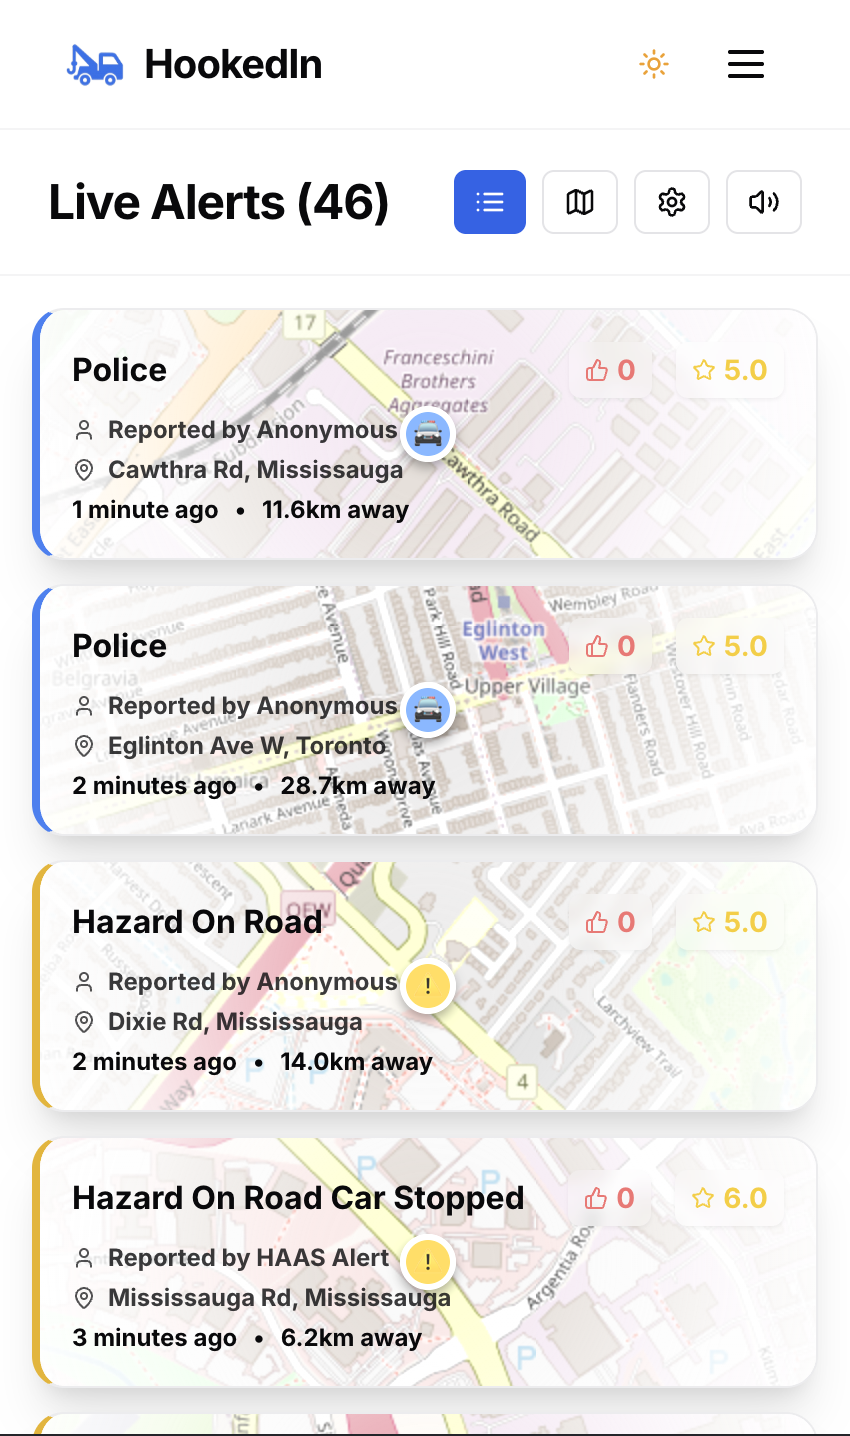
Mobile Live Alerts showing streamlined list view for quick incident assessment
Mobile Interface Elements
- Alert Count: Shows 46 live alerts at the top
- View Toggle: Switch between List and Map views
- Sound Control: Audio notification settings
- Compact Cards: Essential information in scannable format
Quick Alert Assessment
Each mobile alert card provides key details at a glance:
- Alert Category: Clear labeling (Police, Hazard, etc.)
- Reporter Info: Source credibility indicator
- Precise Location: Street addresses and landmarks
- Timing: Minutes since reported
- Distance: Kilometers from your location
- Community Ratings: Star ratings and feedback counts
Section 4: Mobile Map Integration
The mobile map view provides spatial context for strategic positioning:
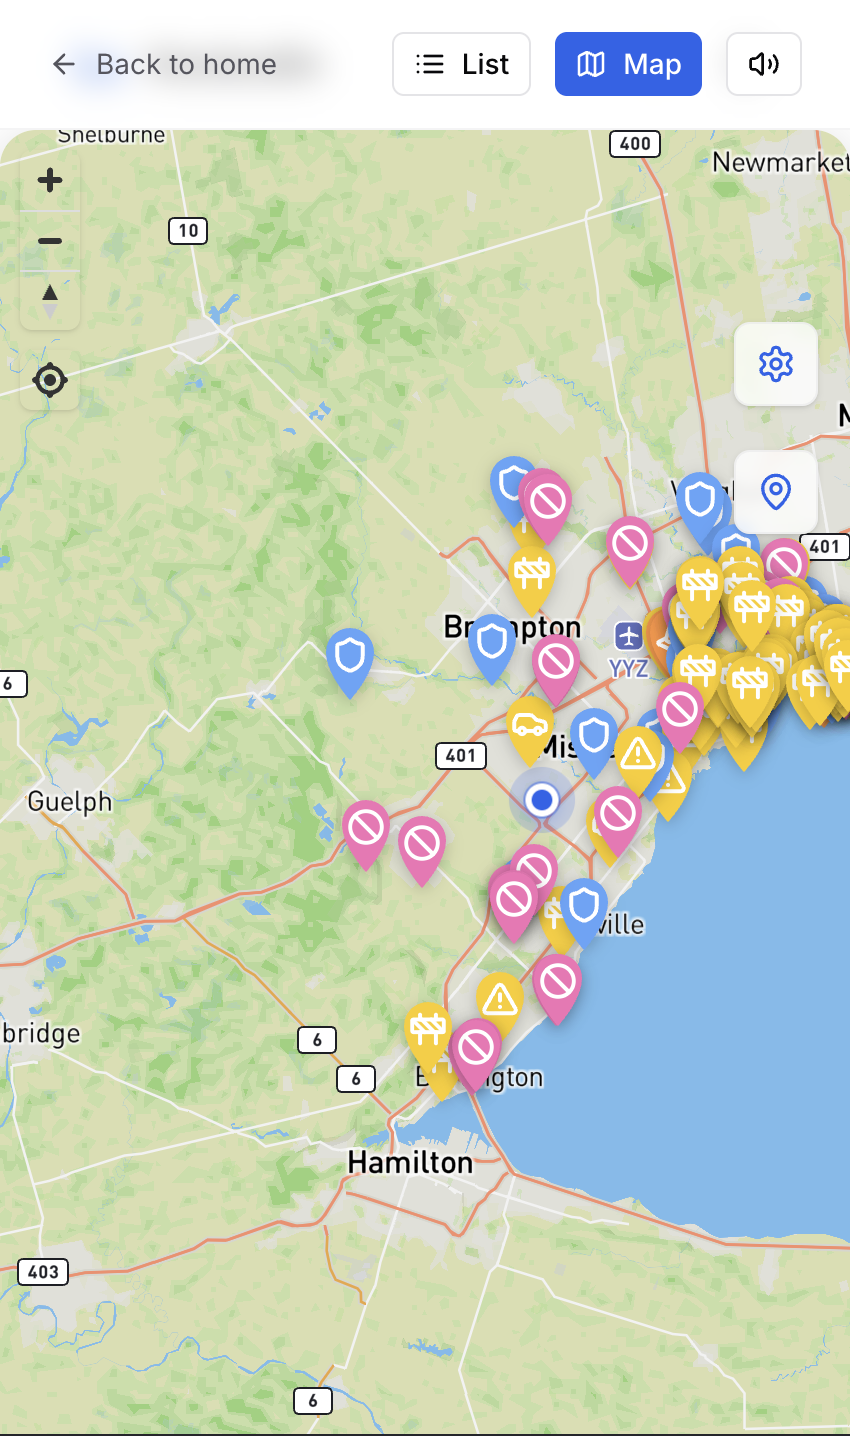
Mobile map view displaying various incident types across the Greater Toronto Area
Understanding Map Markers
Different incident types are represented by distinct markers:
- Blue Shield Icons: Police-related incidents
- Yellow Warning Icons: Hazards and road conditions
- Pink Circle Icons: Traffic disruptions or closures
- Construction Icons: Road work and construction zones
Navigation Features
- Zoom Controls: Plus/minus buttons for map scale
- Location Centering: GPS positioning button
- View Toggles: Switch between List and Map modes
- Settings Access: Gear icon for preferences
Section 5: Optimization Workflows
Here are proven workflows to maximize your HookedIn efficiency:
Morning Setup Routine
- Check Analytics heatmap for today's high-activity zones
- Position yourself in a red zone from the heatmap
- Enable Live Alerts with sound notifications
- Set your distance filter based on current traffic conditions
Active Monitoring Workflow
- Keep Live Alerts open on your primary device
- Monitor alert ratings and choose high-credibility reports
- Use mobile map view to assess multiple incidents simultaneously
- Navigate to the closest profitable opportunity
Strategic Positioning
- Review weekly Analytics data every Sunday
- Identify time-based patterns in your coverage area
- Adjust your schedule to match peak incident periods
- Monitor seasonal trends for long-term planning
Section 6: Advanced Tips and Best Practices
Alert Prioritization
- Reporter Credibility: HAAS Alerts and verified sources take priority
- Time Sensitivity: Newer alerts (under 5 minutes) offer best opportunities
- Rating Quality: Higher-rated alerts indicate reliable information
- Distance vs. Opportunity: Balance travel time against potential revenue
Multi-Device Strategy
- Use desktop for detailed analytics and planning
- Keep mobile for real-time alerts while driving
- Enable notifications across all devices
- Sync your location settings for accurate distance calculations
Seasonal Adjustments
- Winter: Focus on weather-related incidents and hazards
- Summer: Monitor construction zones and tourist areas
- Rush Hours: Position near major commuter routes
- Weekends: Cover recreational areas and shopping districts
Section 7: Troubleshooting Common Issues
Location Accuracy
- Ensure GPS permissions are enabled
- Use "Return to my location" button to recalibrate
- Check your device's location services settings
Alert Delays
- Verify your internet connection strength
- Refresh the page/app if alerts seem stale
- Check notification settings in your device preferences
Performance Optimization
- Close unnecessary background applications
- Keep your app updated to the latest version
- Clear browser cache for web-based access
Getting the Most from Your Subscription
HookedIn offers flexible plans to match your operational needs:
Free Plan Benefits
- Basic live alerts with 15km radius
- Standard incident types
- Mobile and desktop access
Pro Plan Advantages (CA$25/month)
- Extended 30km alert radius
- Advanced Analytics dashboard
- Interactive heatmaps
- Historical trend data
- Priority customer support
"The Pro plan's analytics features typically pay for themselves within the first week by helping you position more strategically."
Success Metrics to Track
Monitor these key indicators to measure your HookedIn success:
- Response Time: Minutes from alert to arrival
- First-on-Scene Rate: Percentage of incidents where you arrive first
- Daily Job Count: Total calls secured per day
- Revenue per Hour: Efficiency of your positioning strategy
- Alert Accuracy: Quality of incidents you respond to
Next Steps
Now that you've mastered HookedIn's features, here's how to continue optimizing your operations:
- Practice Daily: Use HookedIn consistently to build familiarity
- Track Results: Monitor your key performance metrics
- Share Feedback: Help improve the platform with your suggestions
- Stay Updated: Read our blog for new features and industry insights
- Connect with Community: Share your success stories with other operators
🎯 Ready to Get Started?
Join thousands of tow truck operators who have already transformed their business with HookedIn's real-time intelligence.
Start your free trial today - no commitment required, cancel anytime.
Congratulations! You now have the knowledge to maximize every feature of HookedIn's platform. Remember, consistent use and strategic positioning based on data insights are the keys to transforming your towing operations.
Questions about any of these features? Visit our Help section or contact our support team - we're here to help you succeed.